Quantitative Corporate Finance

  • Home
  • Blog
  • Cookbook
    • Capital Allocation
    • Capital Return
    • Debt Capacity
    • Monte Carlo
    • Quantitative Analysis
    • Statistics
    • Sustainable Company Modeling
  • Annotated Glossary
  • About Us
You are Here: QCF » recipe

Adjust Valuation Multiple for Growth

July 20, 2012 by Hans Tallis 1 Comment

If one equity is valued at 15x P/E, and another at 10x P/E, is the latter a bargain?  To answer this question we should adjust for growth.

Adjusting a valuation multiple (such as P/E or EV/EBITDA) is frequently done by dividing by growth — such as with the common P/E/G multiple.

We can do better… [Read more…]
Share this:

  • Click to share on Facebook (Opens in new window)
  • Click to share on LinkedIn (Opens in new window)
  • Click to print (Opens in new window)
  • Click to email a link to a friend (Opens in new window)

Filed Under: Quantitative Analysis Tagged With: recipe

Optimal Capital Structure with Business Disruption Costs

February 18, 2012 by Hans Tallis 2 Comments

In an earlier post we showed that, for a tax-paying firm, WACC is always a declining function of leverage.  If firm value is an inverse function of WACC, this suggests funding operations with 100% debt.

In fact we observe that firm value is concave in leverage and appears to peak when there is some equity in the capital structure.  We’re forced to conclude that firm value isn’t solely a function of WACC, but instead varies in a more complicated fashion with leverage.  In this post we’ll review one theory that explains this, and which can guide us in divining an “optimal” capital structure. [Read more…]

Share this:

  • Click to share on Facebook (Opens in new window)
  • Click to share on LinkedIn (Opens in new window)
  • Click to print (Opens in new window)
  • Click to email a link to a friend (Opens in new window)

Filed Under: Debt Capacity Tagged With: capital structure, download, recipe

Use Distance-Based Peer Analysis

February 9, 2012 by Hans Tallis Leave a Comment

In an earlier post we saw how peer analysis can mislead.  In this post we suggest a better method:  distance-based peer analysis. [Read more…]

Share this:

  • Click to share on Facebook (Opens in new window)
  • Click to share on LinkedIn (Opens in new window)
  • Click to print (Opens in new window)
  • Click to email a link to a friend (Opens in new window)

Filed Under: Quantitative Analysis Tagged With: capital structure, recipe

Mislead with Regression Analysis

December 27, 2011 by Hans Tallis 1 Comment

There are lies, damn lies, statistics, and regression analyses.  In this post we’ll examine some of the abuses of the last style.

Our search for understanding corporate finance leads us to drink from many questionable springs.  Statistical analysis can help or hinder during the journey.  A good rule of thumb is All regression analyses are wrong, but some are useful.

Our example analysis seeks to discover whether paying a dividend increases firm value. [Read more…]

Share this:

  • Click to share on Facebook (Opens in new window)
  • Click to share on LinkedIn (Opens in new window)
  • Click to print (Opens in new window)
  • Click to email a link to a friend (Opens in new window)

Filed Under: Statistics Tagged With: recipe

Calculate WACC With Debt Beta

December 20, 2011 by Hans Tallis 20 Comments

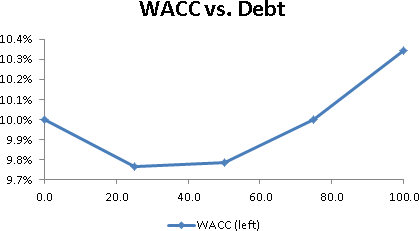
Calculating WACC correctly should preclude its use to optimize capital structure.  In this post we’ll see why.

Traditional WACC Calculation

There was a time when WACC was used to find an “optimal capital structure”, which meant a debt/equity ratio that minimized the cost of capital.  Charts like this were part of the argument:

[Read more…]

Share this:

  • Click to share on Facebook (Opens in new window)
  • Click to share on LinkedIn (Opens in new window)
  • Click to print (Opens in new window)
  • Click to email a link to a friend (Opens in new window)

Filed Under: Debt Capacity Tagged With: capital structure, download, recipe

Get Company Fundamental Data

December 15, 2011 by Hans Tallis 1 Comment

There are a variety of online sources of company fundamental data (historical financial filings).  The easiest and most reliable are the paid services, such as Compustat, Capital IQ, or Bloomberg.

In this recipe we show how to use Yahoo Finance’s “Stock Market Functions” Excel add-in, which consolidates references to a variety of company and market data from several online sources. [Read more…]

Share this:

  • Click to share on Facebook (Opens in new window)
  • Click to share on LinkedIn (Opens in new window)
  • Click to print (Opens in new window)
  • Click to email a link to a friend (Opens in new window)

Filed Under: Sustainable Company Modeling Tagged With: download, recipe

Consider Asset Duration Matching

December 15, 2011 by Hans Tallis Leave a Comment

Separately from overall debt capacity, debt structure reflects specific choice of capital structure instruments.  We address the goal of maximizing shareholder value in two ways:

  • In good times, minimize the expected funding costs of the firm
  • In bad times, minimize the costs of financial distress

In this post we consider duration matching, which clients occasionally propose. [Read more…]

Share this:

  • Click to share on Facebook (Opens in new window)
  • Click to share on LinkedIn (Opens in new window)
  • Click to print (Opens in new window)
  • Click to email a link to a friend (Opens in new window)

Filed Under: Debt Capacity Tagged With: capital structure, recipe

Determine Analysis Type and Information Needs

December 8, 2011 by Hans Tallis Leave a Comment

Corporate Finance Analysis

Better analysis requires more information.  In this recipe you will learn

  • What defines quantitative corporate finance analysis
  • The spectrum of analysis types
  • The data (company fundamental or market) required for each type
  • Trade-offs

The Availability of Data

Information is difficult and costly to acquire.  This issue is at the forefront of quantitative analysis, which elevates the reliance on data in decision making.  The following diagram lays out, left to right, the use of increasing amounts of information: [Read more…]

Share this:

  • Click to share on Facebook (Opens in new window)
  • Click to share on LinkedIn (Opens in new window)
  • Click to print (Opens in new window)
  • Click to email a link to a friend (Opens in new window)

Filed Under: Quantitative Analysis Tagged With: capital structure, recipe