There are lies, damn lies, statistics, and regression analyses. In this post we’ll examine some of the abuses of the last style.
Our search for understanding corporate finance leads us to drink from many questionable springs. Statistical analysis can help or hinder during the journey. A good rule of thumb is All regression analyses are wrong, but some are useful.
Our example analysis seeks to discover whether paying a dividend increases firm value.
Recipe
Here’s how to conduct a regression analysis to answer a common corporate finance query by examining a large population of firms:
- Determine the general model characteristics (regressors, regressand, population, significance test,, etc.)
- Acquire data for the population
- Condition the data (remove error values, transform, etc.)
- Conduct a linear regression analysis. This is easily done in Excel (see e.g. Regression Analysis in Excel).
What Can Go Wrong
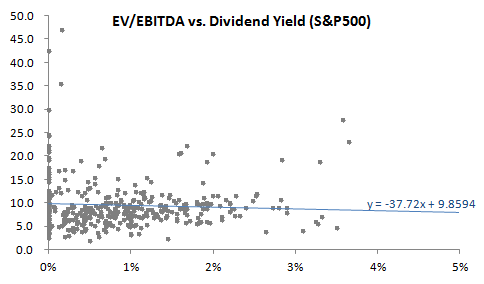
We want to predict whether a change in a firm’s dividend payout ratio can improve the firm’s value. Let’s proxy firm value by EV/EBITDA. Here’s a plot of EV/EBITDA vs. dividend yield for the S&P500:
 You’ll notice that it appears that an increase in dividend yield actually reduces firm value. This is true at an 80% confidence level:
 Are we done? Or perhaps a single-factor regression may not be telling the whole story. Our intuition suggests that dividend-paying firms are also larger and more stable. Perhaps our first regression model should be adjusted to take into account firm size.
To do that we need to another regressor. We want to add a proxy for firm size; let’s use operating earnings (EBITDA), or more specifically, the log of EBITDA.
This changes the picture entirely:
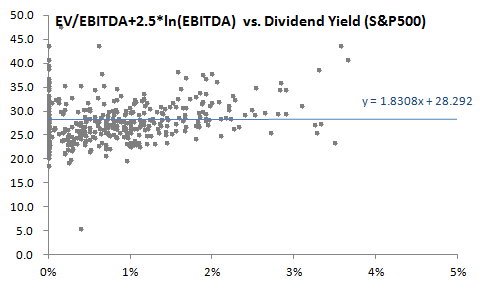
 Notice that dividends are now positively associated with firm value (though with a p-value of 0.9, we suspect there is no relationship at all). This means that indeed our first model wasn’t telling the whole story.
We can demonstrate this graphically by recreating our original scatter plot, but now we “control for” the influence of EBITDA on firm value by removing the EBITDA contribution from the EV/EBITDA values. We do this by adjusting the regressand to remove the influence of the firm-size factor; thus, instead of examining EV/EBITDA, we examine instead ( EV/EBITDA + 2.5 * ln(EBITDA) ):
 Takeaway: Regression analysis benefits greatly when regressors are orthogonal; in finance they almost never are. As it turns out, our two regressors above have a pairwise correlation of +0.24. This explains why adding the ln(EBITDA) regressor changes the coefficient of the Div Yield term in the model.
Lessons
- In finance, all regression models are wrong, but some are useful.
- Regression analysis requires several assumptions. Incorrect selection of regressors is the most common problem with these analyses. Including or excluding a regressor can change the coefficients found for all other regressors. Thus the utility of most regression models for prediction purposes is questionable.
- Conversely, one can derive almost any desired conclusion from a regression analysis through careful selection of regressors. Caveat client.
Alternatives to Regression Analysis
If regression analysis can fail us in so many ways, how else can we predict the result of corporate finance changes? Here are a few other technologies to consider.
- Case study examines a similar firm to see how it was affected by the change. Though rarely providing the best answer immediately, the technique is more valuable for the discussion and brainstorming it can engender. For example, find similar companies that changed dividend levels and study the market reaction.
- Surveys should represent a thoughtful investigation of the question at hand by studying common practice. They can often lead directly to descriptive theories of behavior.
- Find an expert and ask her the answer.
- If expertise is lacking, hire a professional (such as a trained statistician) to analyze the problem.
Leave a Reply