Calculating WACC correctly should preclude its use to optimize capital structure. In this post we’ll see why.
Traditional WACC Calculation
There was a time when WACC was used to find an “optimal capital structure”, which meant a debt/equity ratio that minimized the cost of capital. Charts like this were part of the argument:
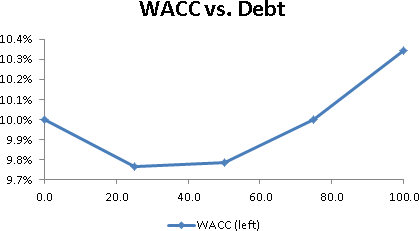 With a finer increment along the X axis, one could pinpoint a minimal cost of capital, which presumably would maximize enterprise (and shareholder) value.
This violates the capital structure irrelevance proposition of Modigliani and Miller: without taxes, leverage does not alter the cost of capital; with taxes, the cost of capital declines with leverage. How was the chart above produced?
An Apparent Mistake
The mistake above is made evident by adding a calculation of enterprise value, which produces the following chart:
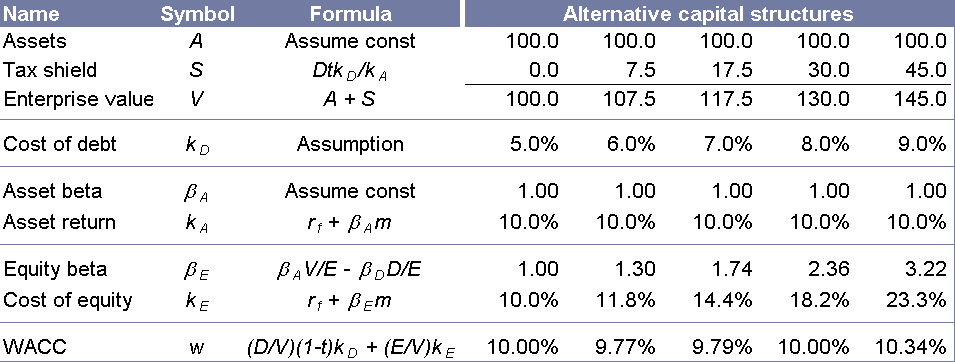
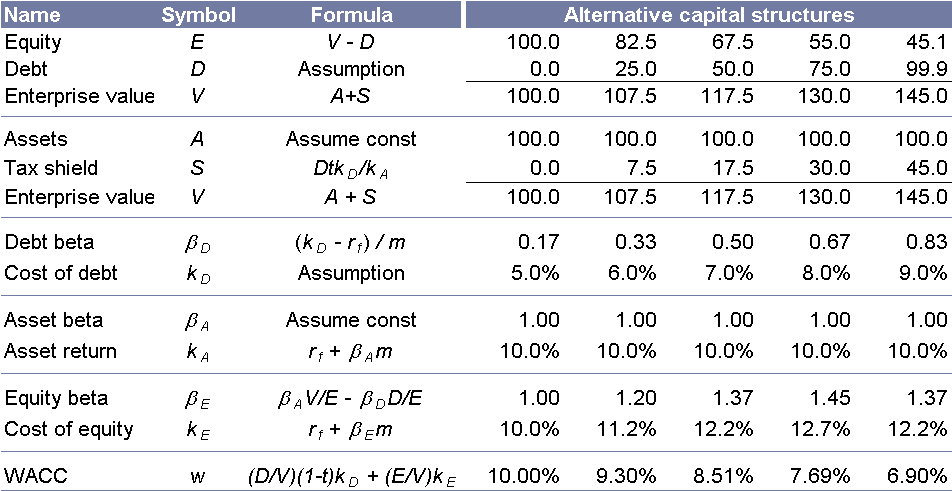
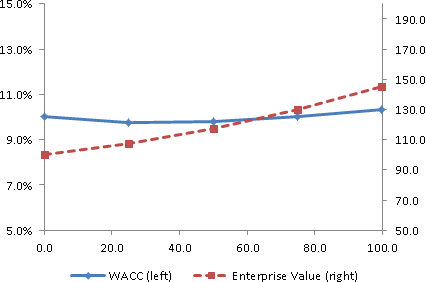 We’ve expanded the Y axis a bit, but the blue curve is unchanged. We’ve added the enterprise value line, which increases monotonically instead of peaking at the point of minimum WACC. Here are the complete calculations:
A few important notes here:
- Notice the relevering formula for equity beta: it includes a term for debt beta, which is often assumed to be zero. This is the single most popular mistake we have seen in the study of “optimal capital structure”, and is the point of this whole post.
- The value of assets is the present value of the stream of earnings they produce. This doesn’t change with leverage.
- EV is the sum of the values of the operating assets (assumed 100.0) and the present value of the tax shield that we realize by reducing tax leakage by deducting interest payments. EV is sometimes calculated as the present value of the operating profits after tax; these two calculations will yield the same value unless a mistake has been made.
- The tax shield is the present value of the tax savings afforded by paying interest. You’ll notice we have discounted these flows at the cost of assets. There is considerable discussion about the riskiness of tax savings; we have taken a somewhat middle ground by discounting at asset risk. Feel free to switch the denominator to Ke or Kd.
- m, the market risk premium, is 6%; the risk-free rate is 4% and the tax rate is 50%.
You’ll notice that we bumped up the cost of debt as leverage increases, which is often done to generate the characteristic WACC “smile”.
Fixing the WACC Calculation
A proper calculation of debt beta, and then properly calculating equity beta, fixes the above problem. Here we show the calculations:
..and the resulting curves:
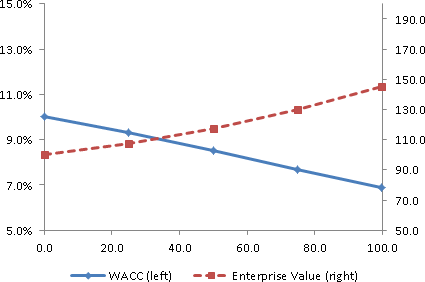 Notice the following important takeaways:
- WACC is minimized where EV is maximized
- Cost of capital decreases monotonically with increasing leverage, which aligns with our intuitions.
- Compared with the incorrect calculations, the cost of equity is lower. If we assume debt beta is always zero, we derive equity beta values that are too high.
- Debt beta is calculated using CAPM. Recall that CAPM can be used to price any asset, so if we are given an assumed cost of debt, we can impute a debt beta.
Why Not 100% Debt?
We have fixed our [download id=”4″] and now the numbers suggest maximizing leverage. Why don’t firms fund with 100% debt? The problem with this argument isn’t the risk of insolvency, at least not within the (unrealistic) assumptions of the Modigliani-Miller and CAPM frameworks: default doesn’t reduce enterprise value.
The problem lies with the ancillary costs of financial distress. Most firms, when approaching a default boundary, experience knock-on impacts on operating cash flows; for example, vendor or customer runs. (The Modigliani-Miller framework does not allow for these “business disruption costs”.) If we allowed for these costs, then the constant “100.0” value of assets above would begin to decline under large amounts of leverage. In this way one can produce a maximum EV at less than 100% leverage.
See https://www.quantcorpfin.com/cookbook/debt-capacity/optimal-capital-structure-with-business-disruption-costs/ for more.
Loose Ends
We casually turned to CAPM to calculate debt beta. Other approaches are discussed by Kaplan and Stein (How risky is the debt in highly leveraged transactions, 1990), Cooper and Davydenko (The cost of debt, 2001), and Groh and Gottschalg ( The risk-adjusted performance of US buyouts, 2006). The CAPM approach is slightly unusual, but we see no reason to not to use it if we are comfortable using CAPM to determine cost of equity.
Cornell and Green (The investment performance of low-grade bond funds, 1991) present a slightly distressing finding: the beta of long-term Treasury bonds from 1960-1989 was measured as 0.2. CAPM of course suggests the beta of a risk-free asset should be 0.
Superb paper. Can you post your Debt Beta calculations,the risk free rate used and the details of your “WACC Calculation with Debt Beta (12)” which is restricted and noted under “Why Not 100% Debt”. Thanks.
Thank you for your kind comment Bryan.
For others reading this: any spreadsheets linked to from this blog are available to registered users. (The content is freely available, but we’d like to know who’s using it!)
No offense, but it would seem to me that your intuition is seriously mis-guided if you think that cost of capital should be decreasing monotonically with increased debt leverage. Practical experience with market debt financing demonstrates this clearly not to be the case – so why spend the time and effort to create a model known to be false on its face?
Maybe I missed the point of the post. What was your intent here? As a practical matter your treatment of debt-beta seems counter-productive.
Hi Steve,
Thank you for the thoughtful challenge. A couple of points:
1) I don’t “think” that cost of capital decreases with debt — that’s a simple consequence of algebra. (Note that many wacc calculations do the algebra wrong — they ignore debt beta, and in the process violate M&M.) Furthermore, I didn’t create any models — what’s calculated above is pure WACC.
2) Cost of _debt_ rises with leverage, but WACC declines — for a taxpayer. (In the absence of taxes, we’re back to the M&M “capital structure irrelevance” world.)
3) It’s true that at some point additional leverage will reduce enterprise value — not because WACC increased, but because cash flows decrease. See https://www.quantcorpfin.com/cookbook/debt-capacity/optimal-capital-structure-with-business-disruption-costs/ for more.
Hi Hans-
I see where I was missing something from your diagram. You only go up to 100% debt-to-equity. LBOs where debt can be several multiples of equity make the smiley face curve even taking into account debt-beta.
Thanks for the follow-up.
Steve
Hi – I am having a hard time figuring out the Debt Beta calculation.
Per your assumption, m = 5%. Since all equity Betas are 1, based on the Asset return Rf = 5% as well.
If I then plug this into the Debt beta assumption, I get:
0 0.2 0.4 0.6 and 0.8 for each of the alternative capital structure scenarios.
What am I missing?
Thanks!
MS
Hi MS,
Thank you for your comment. Two points:
1. The post’s text originally said m=5%; it turns out the calculations and charts assume m=6%. I have update thie corresponding text, and apologize for the error. I have also added the note that risk-free rate = 4%.
2. Though the asset beta is assumed constant (at 1.0), the equity beta increases with leverage.
Hi, I think what you have calculated here is not right because you are double counting the tax shield. Tax shield is already counted for in the Asset value. Just as a simple example, assume you buy a house for which the price does not appreciate and does not depreciate either. If you buy a house for 200K and get back 40K as tax return, does not make the value of your house 240K.
the point is that if you buy the house with all equity then you have the lost opportunity cost and if you buy the house with all debt then you have your interest payment minus tax return. probably in the end without house price change the opportunity cost is bigger than (interest minus tax return) but the asset price is not dependent to tax shield.
you should add tax shield to equity and not to asset for comparison.
Regards,
H.
Hamed,
Thank you for your post.
In the example above, “Assets” refers to the value of assets when all-equity funded. Note that this value is after-tax. Consistent with the example above, we may assume that periodic pre-tax earnings from Assets are $15.38; after a 35% tax they are $10. Capitalizing at the cost of assets (10%) produces a $100 value of assets when all-equity funded.
If we add leverage to the capital structure, total after-tax payments to investors (lenders and shareholders) increase above $10/period, since the company pays less tax. The value of these tax savings is labeled “Tax Shield” in the tables above. This benefit accrues to equity investors.
Your example points out that the same asset may be of different value to different investors, depending on their tax status. We see this today in the rush to wrap real assets in real estate investment trusts (REITs). In this case the same asset is worth more to investors when held by a REIT than when held by a C-corp.
Thanks a lot guys was stuck trying to match equity values from FCFF and FCFE… got the missing link now :D
Hi,
Debt beta is a measure of the *systematic* risk of debt securities. The DRP in Kd would account for more than just systematic risk. So I believe your debt beta estimates (calculated via CAPM) are probably too high. If you correct for this and lower the debt betas then the more familiar WACC curve should return.
Tony
Hi Tony,
Thank you for your note. Two thoughts in response:
1) Whether or not a convex WACC curve (with a minimum point) is more familiar, it’s certainly incorrect. For it to be valid, we would have to abandon Modigliani & Miller’s capital structure irrelevance proposition.
2) CAPM theory, by supposition, applies to all investable assets, and it explains the observed yield on those assets. The returns of any risky asset certainly include nonsystematic (idiosyncratic) variations, but CAPM purports that investors ignore those variations, and only price in systematic risk. This applies to equities, bonds, derivatives, fine art collections, and so on. So if we disallow the use of CAPM for explaining bond yields, it seems inconsistent to allow it to explain equity yields. If you have a non-CAPM framework for explaining asset yields, I would be happy to discuss it!
What is the title (and author) of the paper linked at the emd discussing alternative approaches?
The link is now broken.
Thanks
Vale,
Thank you for pointing out the broken link (regarding alternative calculations of debt beta).
Alas I cannot find a link to the original article (by Julian Franks at LBS). In its place I’ve inserted several other references. I hope this suffices.
Hello
There is something that is bothering me about your calculations, perhaps you could clarify it somehow: You say that Be = Ba(V/E) – Bd(D/E), where B stands for Beta. I think that would be correct only if E + D = A = V, but that only happens if tax = 0, that is, if there are no tax shields.
Am I missing something?
Regards
JP
Hi JP,
Thank you for your thoughtful question.
The value of the tax shield, labeled “S” in the above tables, accrues to equity investors. Thus
V = A + S = D + E
As the tax shield increases, E and V both increase by the change in S. Examples of this calculation are shown in the tables above.
I would like to echo on JP’s comments. The calculation of equity beta should be Beta(E) = A/E*Beta(A) – D/E*(1-tax rate)*Beta(D). This is because the following relationship holds.
RoA = E / A * RoE + D / A * ( 1 – tax rate ) * Interest
Another caveat is the calculation of tax shield. It should be D * tax rate intead of D * tax rate * kd / ka.
These fallacies actually distort the conclusion of this article. The smiley curve of WACC is a result of the value depreciation due to the risk of financial distress when the leverage is high, rather than the mispricing of the equity.
Hi Ryan,
Thank you for your comment. Let me answer your questions in reverse order.
Regarding the (“distorted”) conclusion of this article, it’s useful to keep the top-level picture in mind: it provides a useful cross-check of our algebraic results. The profits (EBIT) of a firm are divided among three claimants: the tax authority (government), lenders, and shareholders. The sum of the lender and shareholder claims equals the (levered) value of the firm. For the same EBIT risk and growth rate (that is, for no change in the operations of the firm), the value of firm increases if and only if the value of the government claim falls. As we increase leverage, the expected value of tax payments falls, and firm value increases. A direct algebraic implication is also that WACC falls. Any “smiley” WACC curve (that shows — anywhere — WACC increasing for an increase in debt) violates this fundamental framework.
Regarding the calculation of tax shield: it is certainly less than the value you suggest, t*D. That value derives from the annuitization of the annual reduction in tax payments ( = t * KD * D ) using a discount rate equal to the cost of debt ( KD ), leaving t*D. However a firm only enjoys a reduction in tax if it pays tax; i.e. if it is profitable. Profitability depends on equity (not total, or enterprise) flows, and thus is riskier than the cost of debt.
In the derivation in the post, we assume the risk of tax shield flows equals the asset risk of the firm. (Asset risk is greater than debt risk, but less than equity risk.) Both of these assumptions about the appropriate discount rate for tax shield flows (cost of debt, and cost of assets) are incorrect however. The actual calculation of tax shield is presented in A Reconsideration of Tax Shield Valuation (Arzac and Glosten, 2004). They derive the value of the tax shield as
..which doesn’t translate easily into a neat discount rate, even if we assume a zero growth rate. Note that this value is less than t*D whenever KD is less than KE; i.e., always.
So, finally, to your first comment about the calculation of equity beta. I believe your derivation assumes that the riskiness of the tax shield flows equals the riskiness of debt. If your formula leads to the conclusion that increasing leverage sometimes increases WACC (producing the WACC “smile”), then it must be incorrect.
Thank you Hans for answering my question and special thanks for sharing the Arzac’s paper.
First, I agree that when tax shield is discounted at the same rate as asset, the formula used in the blog is correct as the tax shield has the same beta as asset.
Second, I agree that the value of tax shield can be lower than D*t due to the risk of profitability.
Without financial distress risk associated with the high leverage, adding more debt always increases the firm value by lessening the tax burden. So the WACC should monotonically decrease as leverage increases.