Do you remember that feeling you got when you heard there wasn’t a Santa Claus? How about when you learned that CAPM is broken?
A couple of charts just crossed my desk, charts which shake certain fundamental beliefs we all have about risk and return.
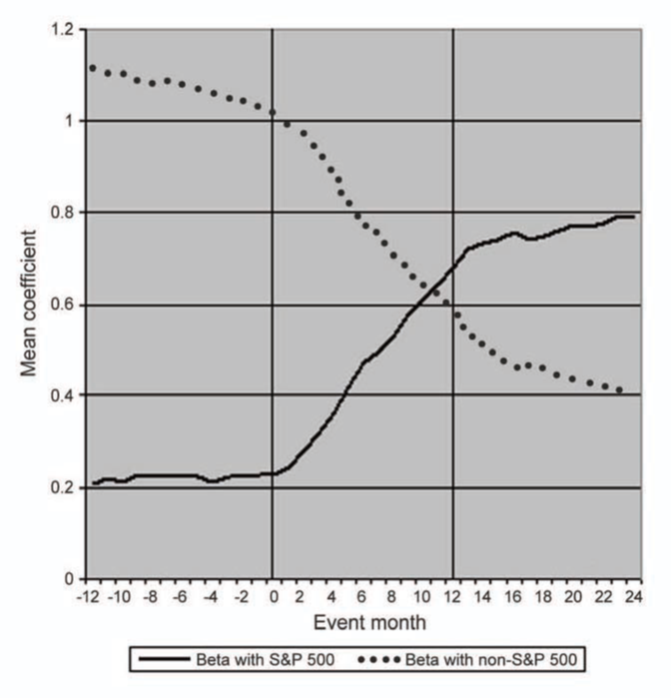
The first one calls into question published values of beta. Barberis et al. studied the change in a stock’s beta (measured as covariance with the S&P500) once it becomes included in the S&P500 index. Here’s what they found:
 As soon as a stock joins the S&P500 index, its beta (measured against that index) increases dramatically. Why is this? A reasonable explanation is that equity prices are increasingly driven by the actions of passive trading (such as that by index funds and ETF’s), instead of by fundamental analysis. In this world the marginal buyers buy and sell the index as a unit, increasing the covariance of price movement for stocks within the index. Lesson: be mindful of your beta calculation method.
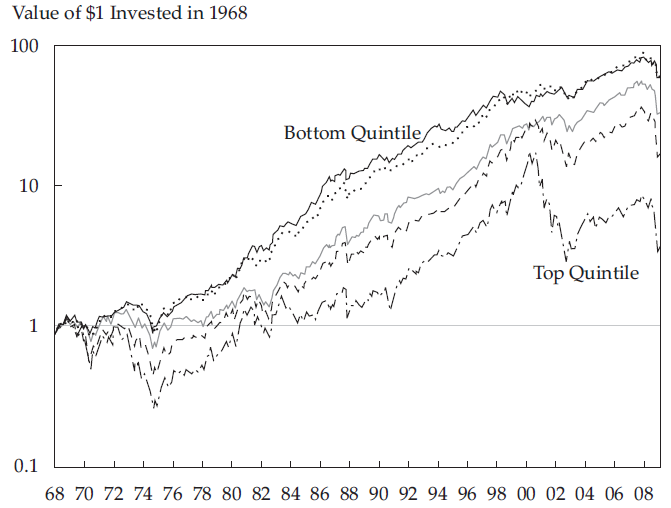
The second chart, from Baker et al. (Benchmarks as limits to arbitrage: Understanding the low-volatility anomaly, 2011) demonstrates equity returns, where stocks are grouped by risk (beta):
Counter to our closely-held intuitions, high risk yields low return.

Leave a Reply